The Weight Tax
Published July 25, 2026 · Playbooks
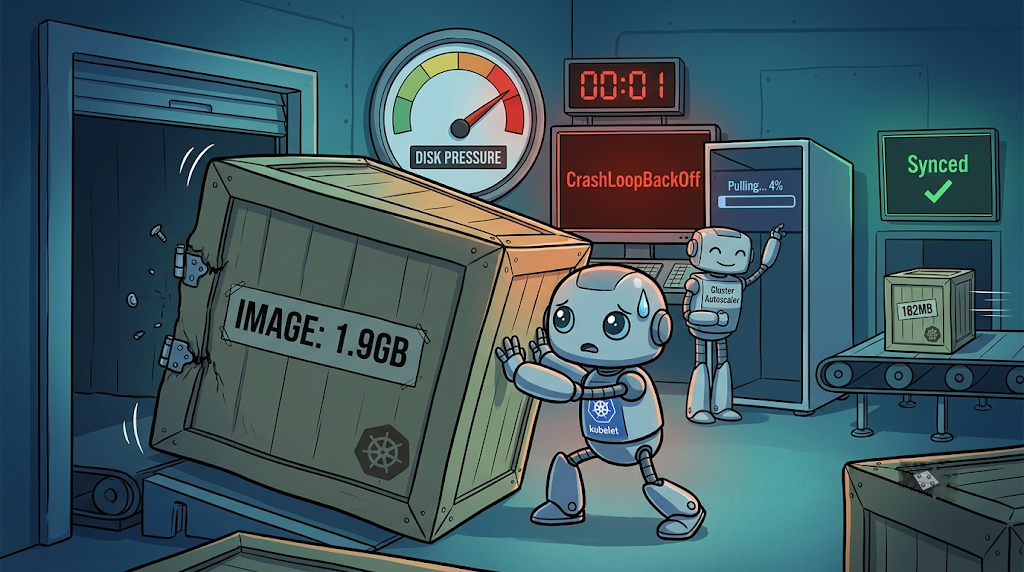
Somewhere in your cluster right now, a Deployment is rolling out slower than it should, a node is quietly thrashing its image cache, and a pod is stuck in CrashLoopBackOff for a reason nobody is going to find in the application logs. Three different engineers open three different investigations, in three different tools, at three different hours of the night. Nobody connects them, because nothing about any of them says "Docker image." One gets blamed on the CNI. One gets blamed on "flaky readiness probes, we'll bump the timeout." One gets a support ticket filed against the cloud provider's autoscaler, complete with a screenshot and the phrase "seems slow?" typed by someone who has clearly given up trying to be more specific. All three have the same root cause: an image that is carrying weight it does not need, and a cluster paying tax on it in a currency none of the dashboards happen to itemize.
This is not a "compress your layers" post. If you have been doing this for more than a year, you already know multi-stage builds exist and that FROM scratch is a real option and not a threat someone made up to scare junior engineers. This is about what image weight actually costs once it leaves your registry and starts running into Kubernetes' machinery, and the handful of BuildKit and cluster-side techniques that go past what Docker's own docs bother to spell out, because their docs are trying to teach you Docker, not trying to explain why your Tuesday deploy took eleven minutes.
Meet Great-Grandpa Alpine
Every org has one. A base image, somewhere upstream of half your services, that was written by someone who no longer works there, has a top comment reading # TODO: slim this down before v1, and has been faithfully copy-pasted into new Dockerfiles ever since, TODO included, like a family heirloom nobody wants but nobody will throw away either. It has three shells in it. It has curl, wget, vim, and a full C compiler toolchain sitting in the final image, because at some point three years ago somebody needed to debug something in production and it was easier to leave the tools in than take them back out. It has an apt cache that never got cleared, because the person writing it copy-pasted the RUN apt-get install line from Stack Overflow and stopped reading before the part about rm -rf /var/lib/apt/lists/*. Nobody built this on purpose. Everybody is running it anyway.
# great-grandpa-alpine, do not question it
FROM ubuntu:20.04
RUN apt-get update && apt-get install -y \
    curl wget vim build-essential git python3-pip \
    software-properties-common
COPY . /app
WORKDIR /app
RUN pip install -r requirements.txt
CMD ["python3", "app.py"]
That is a 1.9GB image with forty-some layers, and it will run your app just fine on your laptop, which is exactly the problem. Your laptop has one node, unlimited local disk, and nobody watching a DiskPressure metric. Your cluster has neither of those luxuries, and it is about to send you the bill in five separate, unmarked envelopes.
Same Root Cause, Five Different Tickets
Rollout lag that isn't your rollout's fault. A Deployment update creates new pods, and each one sits in ContainerCreating for exactly as long as its node needs to pull and unpack the image. A 1.9GB image with forty-plus layers does not just take longer to transfer than a 180MB one over the wire. containerd has to sequentially extract every single layer into the snapshotter, and layer count multiplies filesystem overhead almost independently of total size. Two images can be identical in size on disk and pull at very different speeds because one has six layers and the other has sixty. Someone tunes maxSurge and maxUnavailable for an hour, adjusts progressDeadlineSeconds, and never once opens the Dockerfile that is actually setting the pace.
Node disk pressure that gets diagnosed as a leak. Kubelet's image garbage collector deletes unused images once a node crosses a disk usage threshold, and repulls them the moment something schedules there again. Fat images make that threshold easier to cross and more expensive to recover from, and you end up in a GC-then-repull cycle that looks, from a Grafana dashboard three layers removed from the actual node, exactly like intermittent network flakiness. Somebody spends an afternoon staring at CNI packet-loss graphs before anyone thinks to run kubectl get events and actually read the word NodeHasDiskPressure sitting right there in plain English.
The probe race nobody wins. Be precise about the mechanism here, because it is easy to get wrong: image pull time does not eat your probe budget. Kubelet pulls and unpacks the image first, then starts the container, and only then does initialDelaySeconds begin counting. Pull time shows up as a long ContainerCreating, not as probe pressure.
The real image-weight-to-restart-loop path is two steps removed from that, and both steps are worth knowing. First, a heavy image usually means a heavy process - a bigger runtime, more to load off a cold page cache, a slower first request. Without a startupProbe, that slow start is measured by the liveness probe, whose initialDelaySeconds and failureThreshold were tuned on a warm developer laptop rather than a freshly provisioned node. Liveness fires, kubelet kills the container, and the app never gets far enough to serve. Second, the restart is not free: under DiskPressure the image garbage collector may have already evicted layers, so the restart re-pays the full pull cost, which widens the window in which everything else on that node is degraded too. Round and round.
The fix is a startupProbe with a generous failureThreshold guarding the slow-start window, so liveness only begins evaluating once the app has actually come up - and then getting the image small enough that the startup budget stops being load-bearing. Without that, someone spends a week debugging "flaky startup" in application code that was never the problem. The postmortem template has a field called "root cause." Nobody fills it in with "the Dockerfile," because nobody thought to look there.
An autoscaler that "just doesn't work." Karpenter or Cluster Autoscaler provisions a brand new node in under a minute, which is the entire point of the product and genuinely one of the better engineering stories in the ecosystem. Then that node has to pull every image for every pod scheduled onto it, cold, with absolutely nothing cached, and if your images are heavy, the thing that was supposed to make scaling feel instant now feels like it stalled. Worse: Karpenter's consolidation logic is constantly reshuffling workloads onto fewer, better-packed nodes to save you money, which means this cold-pull tax does not get paid once at scale-up and then forgotten. It gets paid again every time consolidation decides your pod belongs on a different node, which on an active cluster can be several times a day. The feature is doing exactly what it is supposed to do. Your image is the reason it feels expensive.
A registry bill that traces back to arithmetic, not usage. One heavy image pulled onto forty nodes during a cluster-wide rollout is forty full pulls, and if your nodes live in a different subnet or provider region than your registry, that is real egress cost, repeated on every scale-up event and every node replacement for the entire lifetime of the cluster. Nobody puts "reduce base image size" on a FinOps agenda next to reserved instance discounts and spot allocation strategy, but it is frequently a bigger lever than either, and it is also the one item on that list that costs nothing to fix and requires no procurement meeting.
Multiply all of the above by every architecture you support. The day someone on the team gets an M-series laptop and can no longer docker run your x86-only image without watching it crawl under QEMU emulation is the day multi-arch builds become mandatory, and a bloated base image does not get lighter when you target arm64 as well as amd64. It gets built twice, pushed twice, pulled twice, garbage-collected twice, and every one of the five problems above now has two independent copies running on two different node pools. Weight that was merely annoying at one architecture becomes genuinely expensive at two.
A Worked Example
Here is a fairly ordinary Node.js API service, the kind that exists in triplicate at every company that has ever hired more than one backend engineer. Before: built from great-grandpa-alpine-adjacent lineage, weighing in at 1.9GB across 47 layers, because it still has the full npm install cache, dev dependencies, and a copy of the source repo's .git folder that nobody meant to include. After: multi-stage build, distroless runtime, dependency install and cache mount separated from the copy step, coming in at 210MB across 11 layers.
| Metric | Before | After |
|---|---|---|
| Image size | 1.9GB | 210MB |
| Layer count | 47 | 11 |
| Cold pull + extract time (per node) | 38s | 6s |
| 40-pod rollout during an incident | roughly 9 minutes | roughly 90 seconds |
| CI cache hit rate (ephemeral runners) | ~20% | ~92% |
| Karpenter cold-start pod-ready time | 61s | 14s |
These are representative figures from a build of this shape, not a controlled benchmark: they come from a single service on general-purpose cloud instances with the registry in the same region as the cluster and a cold node image cache, and they are illustrative rather than reproducible. Your numbers will move - sometimes by a lot - with instance type and disk throughput, registry locality and whether you have a pull-through cache, layer reuse across your other images, and how much of the rollout runs in parallel. Take the shape of the change seriously and the specific digits loosely.
Nobody on the platform team asked for this table. Nobody put "image hygiene" in the OKRs. The rollout got nine times faster and the incident got shorter, and it happened because someone finally opened a Dockerfile that had not been touched since a person who no longer works there wrote it.
The Toolkit Docker's Own Docs Skim Past
Cache mounts, not cache layers. RUN --mount=type=cache,target=/root/.cache/pip (or /root/.npm, or Cargo's registry cache) gives your build a persistent cache across builds without any of it ever landing in the final image. This is a different trick from ordering your COPY package.json before COPY . ., which only survives as long as the layer cache does, meaning nothing at all on an ephemeral CI runner. A cache mount survives across builds on the same BuildKit instance and never bloats a layer, because it is not a layer. It is a scratch drawer that gets wiped from the final image on purpose.
# syntax=docker/dockerfile:1
FROM node:20-slim AS deps
WORKDIR /app
COPY package.json package-lock.json ./
RUN --mount=type=cache,target=/root/.npm \
    npm ci

FROM node:20-slim AS runtime
WORKDIR /app
COPY --link --from=deps /app/node_modules ./node_modules
COPY --link . .
CMD ["node", "server.js"]
COPY --link to stop cache invalidation from cascading. Ordinary COPY ties a layer's cache validity to everything above it. Change an early layer and every COPY after it invalidates too, even the one copying a config file that hasn't changed since the Obama administration. COPY --link, shown above, builds the copy as an independent layer merged in at the end, so bumping your base image does not blow away the cache for your application code copy. It is one flag. Almost nobody uses it, mostly because almost nobody knows it exists.
Registry-backed remote cache for CI fleets that don't share a disk. Local BuildKit cache is worthless the instant your CI runner is ephemeral, which describes most of them.
docker buildx build \
  --cache-to type=registry,ref=yourregistry/app:cache,mode=max \
  --cache-from type=registry,ref=yourregistry/app:cache \
  -t yourregistry/app:latest --push .
This pushes the build cache itself to the registry as an object separate from your image, so the next runner, a completely different machine that has never seen this repo before, gets the cache hit anyway. This is the difference between every pull request rebuilding from zero and only the layers that actually changed getting rebuilt, and it has nothing to do with image size. It is about not burning ten CI minutes re-solving a problem your teammate's branch already solved an hour ago on a machine that no longer exists.
Squashing can make your fleet slower even as it makes one image smaller. docker build --squash collapses every layer into one, and it will absolutely shrink that particular image's reported size, which is exactly why it shows up on every "10 Docker tips" listicle. What it also does, and what none of those listicles mention, is destroy layer-level deduplication. If fifty of your services share the same base image, containerd's content store stores that base image's layers exactly once per node, and every pod from every one of those fifty services reuses them for free. Squash even one of those images and its base layers get a brand new, unique digest, no longer shared with anything else, pulled and stored again from scratch. You end up with one smaller image and fifty images now fighting each other for disk instead of quietly splitting the cost of a shared base. Measure fleet-wide pull traffic before you squash anything that shares a base with other services, not the single number docker images prints back at you.
Going distroless breaks kubectl exec, and kubectl debug is the fix nobody mentions in the same breath. Dropping the shell and the package manager (distroless, or FROM scratch plus a static binary) is genuinely one of the highest-leverage size and attack-surface wins available, and it also means kubectl exec -it pod -- sh returns OCI runtime exec failed: exec failed: unable to start container process: exec: "sh": executable file not found in $PATH the first time you actually need to poke around a misbehaving production container, usually at 2am, usually while someone in the incident channel is typing "any update?" The fix is not to keep a shell around "just in case," which quietly undoes the entire point of going distroless. It is an ephemeral debug container:
This attaches a fully-featured container into the same process and network namespace as your shell-less one, with the trimmed production image left completely untouched. Most teams either do not know this command exists, or found out about it during the exact incident where they needed it, which is a genuinely unpleasant way to learn a kubectl subcommand.
Provenance attestations can quietly double your manifest complexity. Recent BuildKit versions attach SBOM and provenance attestations by default, which is good practice for supply-chain trust and also means a "multi-platform image" is now a manifest list carrying attestation blobs alongside every platform variant, which shows up as pull overhead you did not budget for. If you are generating those attestations on every internal dev build and not only on release builds, --provenance=false (or mode=min) on the builds that do not need it is worth the two seconds it takes to type, and it will not show up on any dashboard until the day someone finally asks why the manifest for a "200MB image" is somehow fetching several extra objects on every single pull.
Actually look at what you shipped. docker history <image> --no-trunc will tell you which line in your Dockerfile is responsible for which layer, in order, no guessing required. The dive tool goes further and gives you an interactive breakdown of exactly which files in which layers are wasting space, complete with an efficiency score that is deeply, personally insulting the first time you run it against great-grandpa-alpine. Neither of these takes longer to run than the standup meeting where someone asks why the deploy is slow again.
The Actual Point
None of this is about vanity metrics on docker images. It is that a Kubernetes cluster is a distributed system that pays for every byte of image weight over and over: once per node, every time a pod schedules somewhere new, every time a node gets replaced, every time disk pressure forces a garbage collection cycle, every time Karpenter quietly consolidates your workload onto a fresh node to save you money on the very autoscaler that just got blamed for being slow. A single bloated image is a rounding error. The same image, multiplied across autoscaling events, node churn, and a rolling deploy fleet-wide, is a tax collected in rollout minutes, false alarms, and a cloud bill line item nobody ever traces back to a FROM statement written by someone who left the company two reorgs ago.
BuildKit already ships the tools to stop paying it. The Docker docs even mention most of them, somewhere past the point where most people stop reading. Great-grandpa Alpine, wherever he is now, was never trying to cost you nine minutes on every incident rollout. He just wanted to curl something once, in 2023, and never got around to taking it back out.
Source Links
- BuildKit cache mounts documentation
- Docker Build
--cache-to/--cache-fromregistry cache - Build attestations and provenance
- Kubernetes ephemeral debug containers
- Kubelet image garbage collection
- dive: a tool for exploring image layers